There are all sorts of resonances around us, in the world, in our culture, and in our technology. A tidal resonance causes the 55 foot tides in the Bay of Fundy. Mechanical and acoustical resonances and their control are at the center of practically every musical instrument that ever existed. Even our voices and speech are based on controlling the resonances in our throat and mouth. Technology is also a heavy user of resonance. All clocks, radios, televisions, and gps navigating systems use electronic resonators at their very core. Doctors use magnetic resonance imaging or MRI to sense the resonances in atomic nuclei to map the insides of their patients. In spite of the great diversity of resonators, they all share many common properties. In this blog, we will delve into their various aspects. It is hoped that this will serve both the students and professionals who would like to understand more about resonators. I hope all will enjoy the animations.

For a list of all topics discussed, scroll down to the very bottom of the blog, or click here.

Origins of Newton's laws of motion

Non-mathematical introduction to relativity

Three types of waves: traveling waves, standing waves and rotating waves new

History of mechanical clocks with animations
Understanding a mechanical clock with animations
includes pendulum, balance wheel, and quartz clocks

Water waves, Fourier analysis


Tuesday, July 16, 2013

3.21 Reflection and absorption coefficients for transmission lines with loads

All postings by author previous: 3.20 Wave properties for transmission lines up: Contents next: 3.22 Comparison of series and parallel LRC resonant circuits

3.21 Reflection and absorption coefficients for transmission lines with loads

Keywords: transmission line, reflection coefficient, transmission coefficient

Topics covered in this posting

  • One of the most important concepts in the topic of transmission lines is that of how waves on the transmission line interact with a complex load at the end of the transmission line.
  • In this posting we derive the basic reflection and "transmission" coefficients for such waves.
  • We plot these coefficients in a variety of ways.
  • We also derive an expression for the power reflection and absorption coefficients.
  • We discuss the complications of the power reflection coefficient.
1. Basic derivation

In Fig. 1 we see the setup. The incident waves are propagating in from the left, they hit the terminating impedance ZL and are partially reflected. The complex voltage and current amplitudes of the incident wave are V+ and I+ respectively. Those of the reflected wave are V  and I  respectively. The total complex voltage and total current amplitudes due to both incident and reflected waves combined across and through the terminating impedance are VZ and IZ respectively.

The above parameters are inter-related by the characteristic impedance of the transmission line and the terminating impedance. The three pertinent equations are:

        ,        ,         ,   (1)

setup for reflection coefficient setup for change in transmission lines
Fig. 1. Setup for derivations of reflection and transmission coefficients. Positive going waves impinge on the load ZL where they are partially absorbed and partially reflected. Fig. 2. Setup which is mathematically equivalent to that in Fig. 1 at the point where waves enter the second (right most) transmission line (in red). Because this second transmission line is properly terminated so that no waves are reflected at the termination, this transmission line acts as a simple load of impedance ZL at the point where the two transmission lines join, as is illustrated in Fig. 1.

where the minus sign in the middle equation reflects the fact that this wave is propagating in the negative direction and the current associated with the wave is therefore also in the negative direction.

These can be rearranged into the forms:

        ,        ,         .   (2)

The additional equations we need are based on the fact that the voltage VZ and current IZ at the terminating impedance are the sum of the voltages and currents in the incident and reflected waves at the site of the terminating impedance:

        ,         ,   (3)

where in the last equation we substituted relationships from (2).

Substituting IZ from (2) into the second equation of (3) and using the first equation of (3), the second equation from (3) becomes:

graph of reflection and transmission coefficients

Fig. 3. Graph of the reflection and transmission coefficients versus the load impedance divided by the characteristic impedance. For the graph, both the load impedance and characteristic impedance are assumed to be real.

Note that the reflection coefficient is negative in the left end of the graph where RL < R0. This negative value means that the reflected wave is phase shifted by 180 degrees, i.e. inverted, relative to the phase of the positive going wave at RL .

Also note that the two coefficients differ by 1.0 over the entire range of load resistance values. This constant difference is explained in Equation (7) below.

         .   (4)

Simple manipulations of (4) yield:

     .   (5)

Equation (5) yields the amplitude reflection coefficient which is the fraction of the incident wave amplitude that is reflected from the load impedance. If either ZL or Z0 are complex, the reflection coefficient (from (5) ) will in general be complex, meaning that there will be a phase shift (other than 180 degrees) in the reflected wave.


We can also solve the above equations for the fraction of the incident amplitude that is actually impressed on the load impedance. This is called the amplitude transmission coefficient and equals VZ/V+ . The name makes more sense when the "load" is actually another transmission line with a different characteristic impedance than the one the incident wave is transmitted on as shown in Fig. 2. This coefficient then gives the fraction of the incident amplitude that makes it onto this second transmission line, through the change in characteristic impedance. ZL in (5) and (6) is set equal to the characteristic impedance of this second transmission line.

         .   (6)

A careful student might note that the first several steps of (6) show that the amplitude difference between the reflection and transmission coefficients is equal to 1:

         .   (7)

Fig. 3 above shows the reflection and transmission coefficients for real loads on a lossless (with real characteristic impedance) transmission line. Below we graph the real and imaginary parts of the complex reflection and transmission coefficients resulting from complex load impedances in several different ways.

2. Various graphs of the reflection and transmission coefficients
Graphs of the real and imaginary parts of the reflection coefficient
graph of real part of reflection coefficient for complex loads graph of imaginary part of reflection coefficient for complex loads

Fig. 4. The real part of the reflection coefficient versus the real part R of the load impedance divided by the characteristic impedance (assumed real) for various values of the imaginary part X of the load impedance (also divided by the characteristic impedance).

Note that the curve for Xload = -5 is identical to the curve for Xload = 5 so that the latter covers up the former. It is also true that the curves for Xload = 1 and 3 cover those for Xload = -1 and -3 respectively.

Fig. 5. The imaginary part of the reflection coefficient versus the real part R of the load impedance divided by the characteristic impedance (assumed real) for various values of the imaginary part X of the load impedance (also divided by the characteristic impedance).

The imaginary part of the reflection coefficient indicates the fraction of wave amplitude that is reflected from the load that is 90degrees out of phase with the incident wave at the point of reflection.


Graphs of the magnitude and phase of the reflection coefficient
graph of the magnitude of the reflection coefficient for complex loads graph of the phase of the reflection coefficient for complex loads

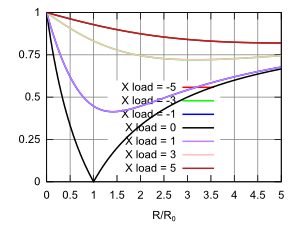
Fig. 6. The magnitude of the reflection coefficient versus the real part R of the load impedance divided by the characteristic impedance (assumed real) for various values of the imaginary part X of the load impedance (also divided by the characteristic impedance).

Similar to Fig. 4, the curves for Xload = 1, 3 and 5 cover those for Xload = -1, -3 and -5 respectively.

Note also that only the curve with Xload = 0 dips all the way to zero.

Fig. 7. The phase or argument of the reflection coefficient versus the real part R of the load impedance divided by the characteristic impedance (assumed real) for various values of the imaginary part X of the load impedance (also divided by the characteristic impedance).

This graph shows the phase of the reflected wave compared with the phase of the incident wave at the point of load or discontinuity. Note that for Xload = 0, the phase undergoes a jump from π radians to 0 radians at unity coupling. This same effect is shown in Fig. 3 where the reflection coefficient goes from negative to positive at the same point. It is similarly shown in Fig. 4 for the Xload = 0 curve.


Graphs of the real and imaginary parts of the transmission coefficient
graph of the real part of the transmission coefficient for complex loads graph of the imaginary part of the transmission coefficient for complex loads

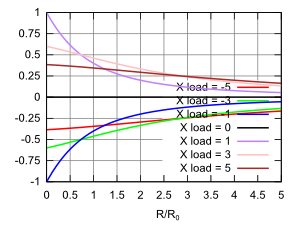
Fig. 8. The real part of the transmission coefficient versus the real part R of the load impedance divided by the characteristic impedance (assumed real) for various values of the imaginary part X of the load impedance (also divided by the characteristic impedance).

Similar to Fig. 4, the curves for Xload = 1, 3 and 5 cover those for Xload = -1, -3 and -5 respectively.

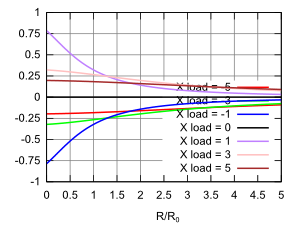
Fig. 9. The imaginary part of the transmission coefficient versus the real part R of the load impedance divided by the characteristic impedance (assumed real) for various values of the imaginary part X of the load impedance (also divided by the characteristic impedance).

The imaginary part of the reflection coefficient indicates the fraction of wave amplitude that is actually impressed on the load that is 90degrees out of phase with the incident wave at the point of reflection.


Graphs of the magnitude and phase of the transmission coefficient
graph of the magnitude of the transmission coefficient for complex loads graph of the phase of the transmission coefficient for complex loads

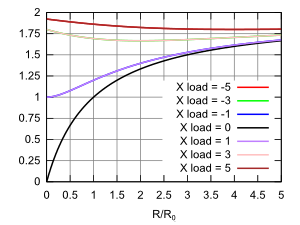
Fig. 10. The magnitude of the transmission coefficient versus the real part R of the load impedance divided by the characteristic impedance (assumed real) for various values of the imaginary part X of the load impedance (also divided by the characteristic impedance).

Similar to Fig. 4, the curves for Xload = 1, 3 and 5 cover those for Xload = -1, -3 and -5 respectively.

Fig. 11. The phase or argument of the transmission coefficient versus the real part R of the load impedance divided by the characteristic impedance (assumed real) for various values of the imaginary part X of the load impedance (also divided by the characteristic impedance).

This graph shows the phase of the reflected wave compared with the phase of the incident wave at the point of load or discontinuity.


Complex mappings of the complex reflection and transmission coefficients
reflection coefficient mapped on the complex plane transmission coefficient mapped on the complex plane

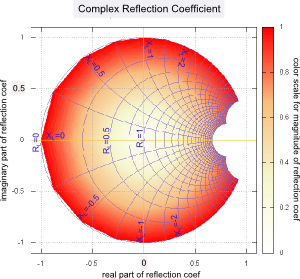
Fig. 12. This chart looks very similar to the standard Smith chart because, except for the coloring, it is the same. You read it by locating (using the blue grid lines) the point that represents the real RL and imaginary XL components of the normalized load impedance (divided by the characteristic impedance of the transmission line) and reading off on the axes the real and imaginary components of the reflection coefficient. The standard Smith chart also has an angular scale around the outer perimeter so you can read off the polar representation of the complex reflection coefficient as well as one or more other quantities.

The color shading indicates the magnitude of the reflection coefficient. Note that it is maximum (equal to 1.0) around the perimeter and zero at the center. If graphed with more precision, the colored region would be perfectly circular, and not displaying the straight line edges.

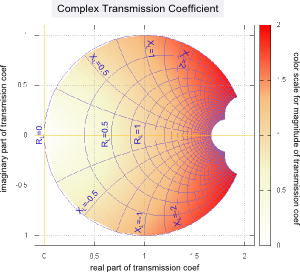
Fig. 13. This chart is very similar to Fig. 12 except that this chart displays a mapping of the complex transmission coefficient. As noted in Equation (7) the transmission coefficient is numerically the same as the reflection coefficient, except that it is offset in the real direction by +1.0 . Indeed, except for the coloring, it is the same chart as shown in Fig. 12 shifted by +1.0 so that the center of this chart is located at (1,0) instead of the (0,0) of Fig. 12.

The coloring is quite different between Fig. 12 and Fig. 13. Whereas Fig. 12 is darkest (equal to 1.0 on the color scale) on the edges, Fig. 13 is darkest (equal to 2.0) on the right edge, representing large values of the load impedance, independent of whether it is real or imaginary. This is consistent with the graph in Fig. 3 above.

Note that a transmission coefficient greater than one does not mean there is a magical amplification of wave power at higher load impedances. The characteristic impedance (or load impedance) is involved in the transmitted (or absorbed) power fraction and this impedance always conspires to insure that the power actually transmitted (or absorbed) is less or equal to the power of the incident wave.

We discuss the question of power next.


The above graphs and charts assume that the load impedance will involve a positive real part (the resistance R ) and a positive or negative imaginary part (the reactance X ). This is the case for all passive loads whether simple or resonant. For active gain elements these constraints are often not valid.


3. Power absorbed by the load impedance

We can solve for the fraction of incident power absorbed by the load:

         ,   (8)

where V * is the complex conjugate of the phasor V. See an earlier posting or wiki for a discussion of calculating average power with phasors. In the final step of (8) we have used the fact that any phasor multiplied by its own complex conjugate equals its magnitude squared which is real and can be taken through the Re( ) operator.

The first factor on the right side of the equation is just the magnitude of the transmission coefficient in (6) squared. The numerator and denominator can be simplified by using the trick:

         ,   (9)

to yield:

     ,   (10)

where RL is the real part of the load impedance ZL and R0 is the real part of the characteristic impedance of the transmission line Z0. If Z0 is real (lossless transmission line approximation), then this equation becomes:

         .   (11)

Fig. 14 below graphs the absorbed power fraction as per Equation (10) as a function of the real part of the load impedance for various values of the imaginary part of the load impedance. Both parts of the load impedance have be divided by the characteristic impedance, which we have assumed to be totally real (a lossless transmission line).

We see from the graph that the absorbed power fraction becomes 1.0 only if the imaginary part of the load impedance is zero and the real part equals 1.0 . This is the condition of a load matched to the transmission line and allows all the power in the incident wave to be absorbed by the load. The black curve plots Equation (11), i.e. the condition of the load impedance being real.

Fig. 15 is a color mapping of Equation (10) on the complex plane. The axes are the real and imaginary parts of the load impedance.

Graph of the power fraction of the incident wave which is absorbed by the load The power absorbed fraction mapped on the complex normalized load impedance
Graph of power absorbed by complex load mapping of the power absorbed on the complex plane of load impedance

Fig. 14. The power absorbed versus the real part R of the load impedance divided by the characteristic impedance (assumed real) for various values of the imaginary part X of the load impedance (also divided by the characteristic impedance).

Similar to Fig. 4, the curves for Xload = 1, 3 and 5 are identical to and cover those for Xload = -1, -3 and -5 respectively.

Fig. 15. To use this chart, one locates on the x and y axes the values corresponding to the real and imaginary parts of the load impedances (divided by the characteristic impedance of the transmission line). Then the color of the mapping at this point can be read to indicate the fraction of the incident wave power that is absorbed by this load impedance. The chart indicates the maximum at ZL = 1.0 in the left center of the chart. The contour lines verify this.

The fraction of power reflected by the load is called the power reflection coefficient. Because of conservation of energy, it is simply one minus the fraction of absorbed power:

    .    (12)

Another approach to this is to realize that the reflected wave travels on the same transmission line as the incident wave so that we would expect the power reflection coefficient to be the magnitude of the amplitude reflection coefficient squared.

    .    (13)

It turns out to be more complicated that (13) implies. Equation (13) is only valid if the characteristic impedance Z0 (see Eqn. (17) of the previous posting) of the transmission line is real. This means (13) is valid only if either we have no (or small) attenuation in the transmission line OR R1 and G1 of the transmission line are balanced to make a distortionless transmission line and  G1/C1 = R1/L1  (also called the Heaviside condition). A little algebra will confirm that Eqns. (12) and (13) are not equal unless Z0 is real. Equation (13) is often given in text books because, in practice, most transmission lines are very low loss and often constructed as to be distortionless as well.

4. Calculation of error in Equation (13)

The waves on a transmission line (written either in terms of voltage V or current I) are governed by a linear set of differential equations. This allows us to split up a complicated wave into wave components in a number of different ways to simplify the math and help our understanding.

The problem with (13) stems from the fact that power is not linearly related to the amplitude of the waves. This makes splitting up a complicated wave into components on the basis of power problematical. To illustrate our point, we will next calculate the power flow for a wave that is composed of both positive going and negative going components. The time-averaged power in this wave is given by:

    .    (14)

The first two terms on the last line of (14) are simply the powers we might simplistically associate with the positive and negatively going components of the wave. The troublesome part of (14) is the last part of (14) which we might call the "cross terms" of the two wave components. The cross terms indicate the extra power that comes from the interaction of the two wave components. Next we investigate these cross terms:

,    (15)

where in the last operation we used the fact that Re(Z) = Re(Z*) . The last line makes it clear that the cross terms will cancel and be zero in total if the characteristic impedance Z0 of the transmission line is totally real.

A question might arise as to what this means in a real, physical setup where the incident and reflected waves can be physically separated. Where does this extra interaction power manifest itself? It would obviously mean that in the places or devices that combine or separate the wave components, we could see an extra interaction energy entering into the mix. One would need to look at the particulars of the exact setup to discuss this further.


All postings by author previous: 3.20 Wave properties for transmission lines up: Contents next: 3.22 Comparison of series and parallel LRC resonant circuits